Produces a breakdown of number of customers, number of items sold, sales ($), per department.
1 |
Click the Penetration button under the Sales tab of the toolbar. |
2 |
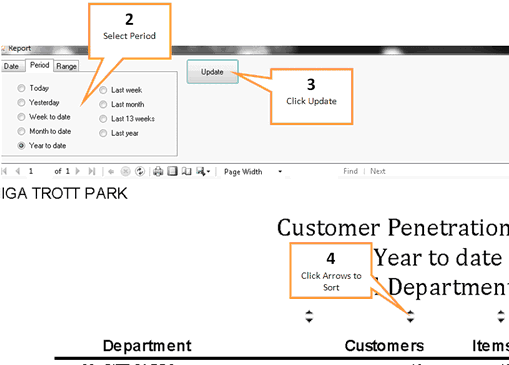
Select period of time that you would like the report on using the period field.
•Date Tab: This tab displays sales figures for; Year, Month, Week, Days. You can choose to display sales figures using Week ending or Week Starting. To expand or collapse the dates, click the Plus / Minus sign next to the Year, Month, Week or Days. •Period: The Period tab allows you to select from commonly used periods. These include, but are not limited to, Yesterday, Week to Date and Last month. Flag the relevant period by clicking on it when using this tab. •Range: The Range tab allows you to nominate a start and end date for the sales included in the report. Select both a start and end date that encompasses the period of interest when using this tab.
|
3 |
Click the Update button.to produce a report. |
4 |
Click the arrows at the top of each column to sort by that column. E.g. Clicking the sales arrow will list the departments by sales ($) with the department with the greatest sales listed first. |
5 |
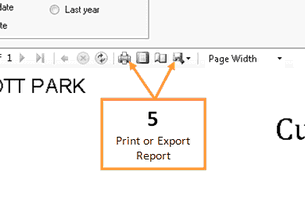
Print or export the report. (You can export to Excel, PDF or Word documents).
|