Movement
This section allows you to have your report ranked from Fastest selling product to Slowest selling product or vice versa.
If Fastest moving is flagged the fastest moving products will appear at the top of the report.
If Slowest moving is flagged the slowest moving products will appear at the top of the report.
Sorting
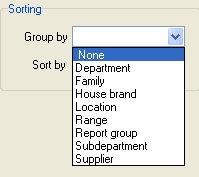
Group by - Choose how you would like to group the items for your sales data. E.g. by department.
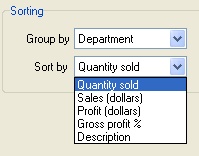
Sort by - Choose how to display the sales figures. There are various options which will sort the report based on product info.
Use the drop down arrow and highlight the groupings you would like to use.
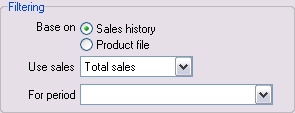
Filtering - Base on
Sales History - All sales figures.
Product File - All sales figures for grouped products (eg family, report groups, locations etc.)
Filtering - Use sales
Select the desired setting by using the drop down arrow.
All Sale Types: Will not sperate different sale types
In-store Sales: Sales figures for products sold on In-store promotions only.
Normal Sales: Sales figures for products sold at Normal sell only.
Promo Sales: Sales figures for products sold on Promotion only.
Total Sales: All sales figures will be used.
Warehouse Sales: Sales figures for Warehouse products only.
Filtering - For Period
Click the drop down arrow to display period screen.
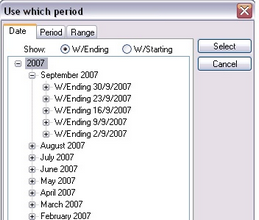
Date Tab: This tab displays sales figures for; Year, Month, Week, Days. You can choose to display sales figures using Week ending or Week Starting. To expand or collapse the dates, click the Plus / Minus sign next to the Year, Month, Week or Days.
Period: The Period tab allows you to select from commonly used periods. These include, but are not limited to, Yesterday, Week to Date and Last month. Flag the relevant period by clicking on it when using this tab.
Range: The Range tab allows you to nominate a start and end date for the sales included in the report. Select both a start and end date that encompasses the period of interest when using this tab.
When you have clicked/highlighted the date range you want, click the Select button.
Options - List
Choose between listing only Master APNs and Listing Multi APNs.
Options - Lines to print
You can type in the number of lines you wish to have in the report (eg: 100 will mean only the top 100 lines will be listed).
Options - Cut off
The minimum number of sales in the period of interest required for an item to appear on the report. (E.g. if 20 is selected only products that have 20 or more sales will appear on the report).
Options - Qty Decimals
Refers to weight items (e.g. Fruit & Veg) in grams. This is the number of decimal places that will be displayed in the quantity column. E.g. if Qty Decimals (No decimals) is selected a quantity will appear as ##, if Qty Decimals (2 decimal places) is selected a quantity will appear as ##.##
Filter Tabs
Set up the filters you would like as per the Filtering Options instructions.